Heartbeat of the Hickory: Summer 2025

Texas Water Legislation
Drought isn’t just “no rain.” It refers to a prolonged period of below‑normal precipitation leading to serious water shortfalls. Experts identify several types :
Meteorological drought: reduced rainfall over an extended period.
Agricultural drought: dry soil conditions harming crops and increasing irrigation needs.
Hydrological drought: diminished water in rivers, reservoirs, and aquifers.
Socioeconomic drought: water scarcity affecting economic activities and public well-being.
Some definitions also include “flash droughts”—rapid-onset droughts occurring in days or weeks
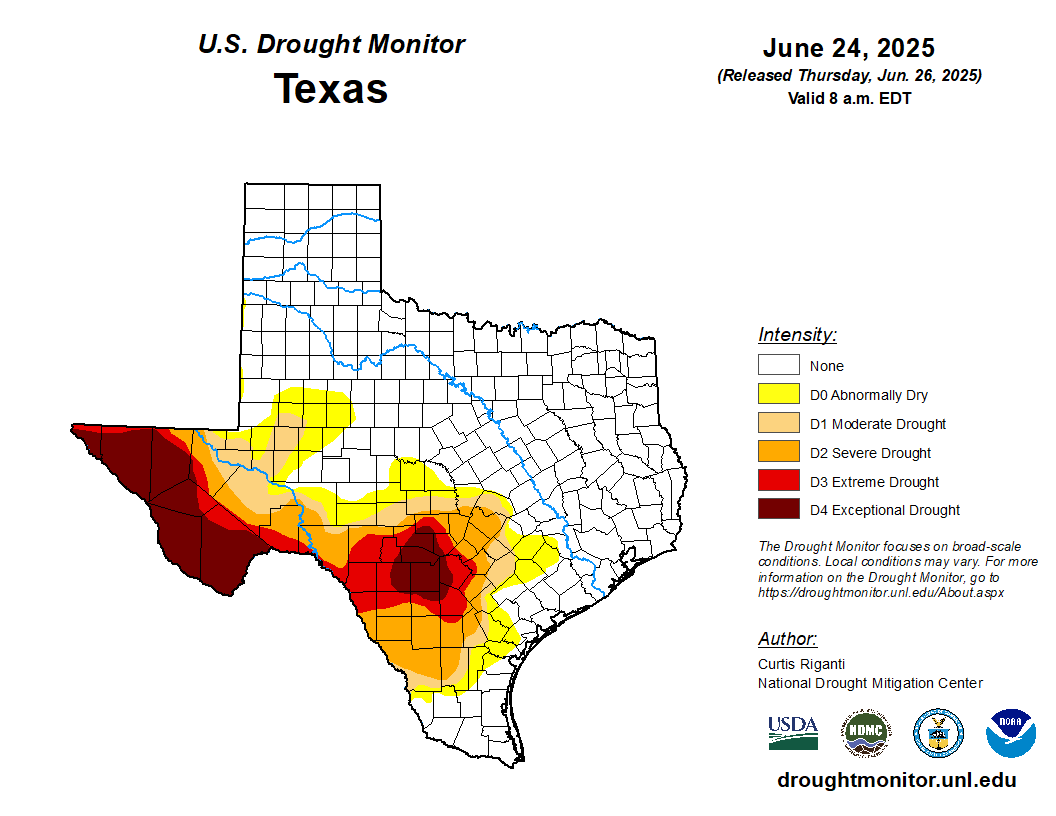
Texas is navigating a multi-year, multi-faceted drought, spanning meteorological, agricultural, hydrological, and socioeconomic dimensions. Its impacts range from diminished farm yields and stressed ecosystems to tight municipal water controls and wildfire threats. Part of the solution is aggressive conservation policies starting at the State level down to local GCDs and municipalities. Ultimately, the onus falls on the shoulders of all water users. Sustained action is essential to weather this crisis and build future resilience.
On June 18, 2025, Gov. Greg Abbott signed two legislative measures to launch a multi-decade, $20 billion investment addressing Texas’s escalating water challenges. A one-time $2.5 billion allocated to the Texas Water Fund, drawn from this year’s budget surplus—no voter approval required.
Voters will decide in November whether to dedicate $1 billion annually (starting in 2027) from state sales taxes to water infrastructure until 2047
Texas loses about 88 billion gallons of water yearly due to aging, leaky pipelines; Houston alone loses approximately 30 billion gallons, with nearly $5 billion in repair needs Rapid population growth and expanding industries—especially oil, gas, and data centers—are increasing water demand
If voter-approved, this package would be the largest water infrastructure investment in Texas history, aiming to reduce water loss, expand supply, and bolster long-term resilience.
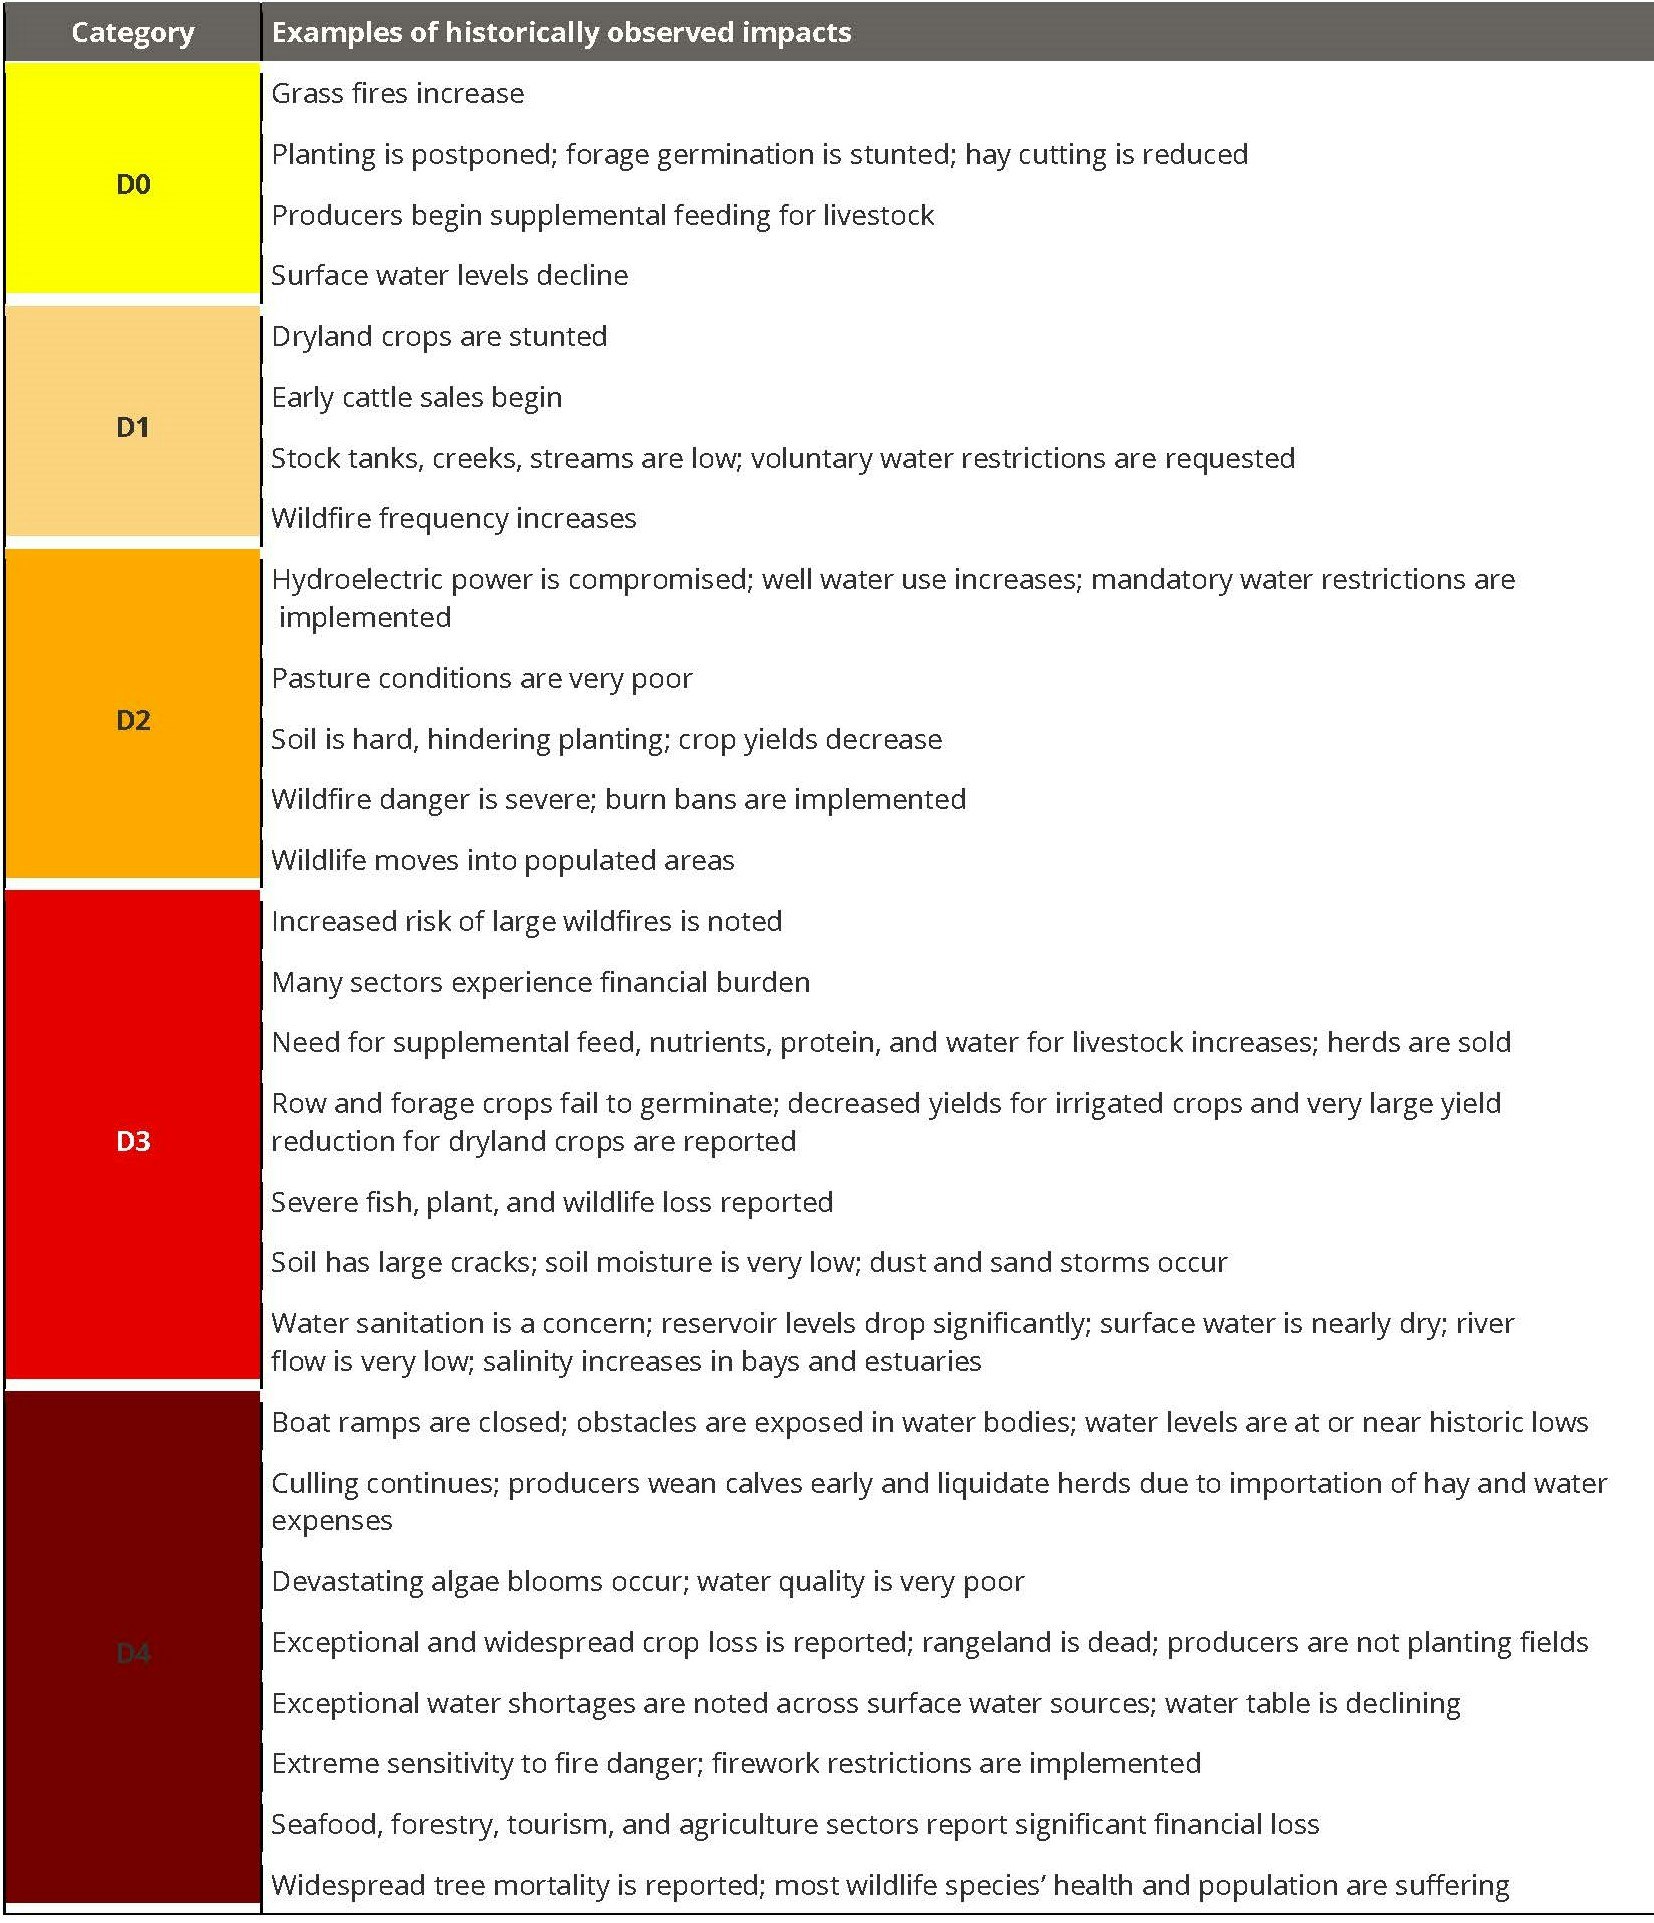
Every newsletter we print the latest Drought Monitor color coded by drought intensity, but we’ve never bothered to explain what those various intensities actually mean. Below is a chart of historically observed impacts for each category.
Historic Impacts
No two states have the same experience during a drought. Below are examples of some of the impacts experienced in Texas in the past. The process for developing this example impact table is described in Noel, M., Bathke, D., Fuchs, B., Gutzmer, D., Haigh, T., Hayes, M., Poděbradská, M., Shield, C., Smith, K. and Svoboda, M., 2020. Linking drought impacts to drought severity at the state level. Bulletin of the American Meteorological Society, 101(8), pp.E1312-E1321. doi: 10.1175/BAMS-D-19-0067.1. To view a more complete record, and to filter impacts by drought severity, sector and season, check out the interactive State Impacts Tool (https://droughtmonitor.unl.edu/DmData/StateImpacts.aspx)